How to Calculate ROI on AI Automation Before You Commission Anything

On UK Business Forums, one owner put it bluntly: the general consensus is that it is often quicker to do the work yourself than to verify what AI produces. Another described watching a consultant's AI tool use nominal APR instead of effective interest rates — a small difference that would have put the business in breach of regulations. A third summarised the mood of every founder who has sat through an automation pitch: what people want is savings, improved delivery, and consistency — not technology for its own sake.
That is the real brief. Not "automate everything." Just: show me the money, or don't waste my time.
This article is the maths. A framework you can run on your own business, with your own numbers, before you speak to any agency — including us. If the calculation says don't automate, the answer is don't automate. The honest ROI calculation is the due diligence that separates a productive investment from an expensive distraction.
We have already covered which tasks to automate first and the tools available to do it elsewhere in this series. This piece assumes you have identified a candidate process. The question now is whether the numbers work.
Step 1: Calculate what your people actually cost per hour
The single biggest error in amateur ROI calculations is using the salary figure. An operations manager earns £45,000. That is not what they cost.
Employer National Insurance runs at 15% on all earnings above £5,000 per year (HMRC, 2025/26 rates). Auto-enrolment pension contributions add a statutory minimum of 3% of qualifying earnings between £6,240 and £50,270 (The Pensions Regulator, current thresholds). Then there is the office space, equipment, software licences, recruitment cost amortised across tenure, and management overhead.
The most widely-cited multiplier for converting base salary to total employment cost — 1.25× to 1.4× — originates from Joseph Hadzima at MIT Sloan, writing about US employment costs. The closest UK-specific equivalent is CEBR's analysis for the Federation of Small Businesses, which found non-wage costs at approximately 15% of total employment costs before overheads (CEBR/FSB, 2014 base). Updated for the current NI rate and pension minimums, the realistic UK range is 1.25× for statutory-only costs up to 1.40× with recruitment, equipment, premises, and management included.
One caveat that most automation agencies omit: the Employment Allowance of £10,500 means a small employer — five or six people on modest salaries — may pay zero employer NI after the allowance. If that describes your business, using the full 15% NI in your calculation overstates the cost you would actually save. Be honest with the inputs, or the outputs are worthless.
Here is what the numbers look like for four common UK SME roles. The bookkeeper figure uses ONS ASHE 2025 provisional data (SOC 4122: £31,876 median). The operations manager, marketing coordinator, and customer service figures are cross-referenced estimates from Indeed, Reed, and CV-Library — ASHE does not report a clean median for these roles at the SOC granularity needed, so treat them as reasonable mid-points rather than official statistics.
| Role | Base salary | Fully-loaded (1.33×) | Per hour (1,750 hrs) |
|---|---|---|---|
| Operations manager | £45,000 | £59,850 | £34 |
| Bookkeeper / accounts | £32,000 | £42,560 | £24 |
| Marketing coordinator | £35,000 | £46,550 | £27 |
| Customer service representative | £25,000 | £33,250 | £19 |
The 1,750-hour denominator assumes 37.5 hours per week, minus 28 days' statutory holiday, minus an estimated 5 sick days. Some calculators use 1,460 hours to account for non-productive time. The lower figure is arguably more honest — nobody is productive for every paid minute — but it inflates the hourly rate in a way that flatters the automation case. Use 1,750 for a conservative calculation.
Your turn: write down your number
Open a spreadsheet or grab a pen. For the person who performs the process you are considering automating:
A. Their base salary: £ ________
B. Multiply by 1.33 (or use 1.25 if you qualify for the full Employment Allowance and have minimal overhead): £ ________
C. Divide by 1,750: £ ________ per hour
That is your cost input. Keep it visible — you will need it for every step that follows.
Step 2: Measure the time the manual process actually takes
This is where most automation pitches go wrong. They use generic statistics — "employees waste X hours per week on admin" — and apply them to your business without checking whether the number is real. We have covered those generic figures before. This section is about specific, per-task benchmarks you can validate against your own operation.
Invoice processing
The best primary source is Ardent Partners' annual State of ePayables report, surveying 212 accounts payable professionals. Their 2024 data shows an average invoice processing cycle of 9.2 calendar days, with best-in-class organisations at 3.1 days and the rest averaging 17.4 days. The hands-on labour time per invoice — the part that matters for an automation calculation — sits at roughly 10 to 15 minutes for a fully manual process: opening the email, entering the data, matching to a purchase order, getting approval, scheduling payment (Ardent Partners, State of ePayables, 2024).
Separately, a 2025 UK study found that 49% of UK SME CEOs and COOs spend four hours per week on payment-issue administration alone — roughly two full days per month on chasing, reconciling, and correcting invoices rather than running the business (Sage, May 2025; sample size not transparently disclosed).
Monthly management reporting
APQC's Open Standards Benchmarking data, drawn from 2,300 organisations, puts the median monthly close cycle at 6.4 calendar days. The top quartile closes in 4.8 days or fewer. The bottom quartile takes 10 days or more (APQC, Open Standards Benchmarking). For an SME finance team of one or two people, the monthly close and reporting cycle typically consumes the better part of a full working week — not because the individual tasks are complex, but because they involve pulling data from multiple systems, reconciling discrepancies, reformatting for presentation, and doing it again when someone spots an error.
Sales follow-up
HubSpot's 2024 State of Sales report, surveying 1,400 sales professionals, found that salespeople spend approximately 13 hours per week writing emails — 21% of their working time (HubSpot, State of Sales, 2024). Salesforce's 2026 edition confirmed the pattern: sales representatives spend only 36–40% of their time on actual selling, with the rest consumed by preparation, administration, and chasing (Salesforce, State of Sales, 2026).
A note on missing benchmarks
Some processes you might want to automate — client onboarding, data reconciliation between systems, proposal generation — lack rigorous UK benchmarks with disclosed methodology. Practitioner surveys from accounting software vendors suggest 1–2 hours of professional time per client for onboarding in well-organised firms, stretching to 12–15 hours in disorganised ones. But these figures come without disclosed sample sizes, and you should not treat them as reliable. Use them as a starting point for your own measurement, not as a substitute for it.
Your turn: time the process
This is the exercise that matters more than any external benchmark.
Pick the process you are considering automating. For one representative week, track it with a timer — not from memory. Log:
D. Hours spent on the core task: ________ hrs/week
E. Hours spent on corrections, chasing, and rework: ________ hrs/week
F. Total (D + E): ________ hrs/week
Now calculate the annual cost:
G. Total hours (F) × Hourly cost (C) × 52 = £ ________ per year
Write that number down. It is the maximum the automation can save you — the ceiling, not the floor.
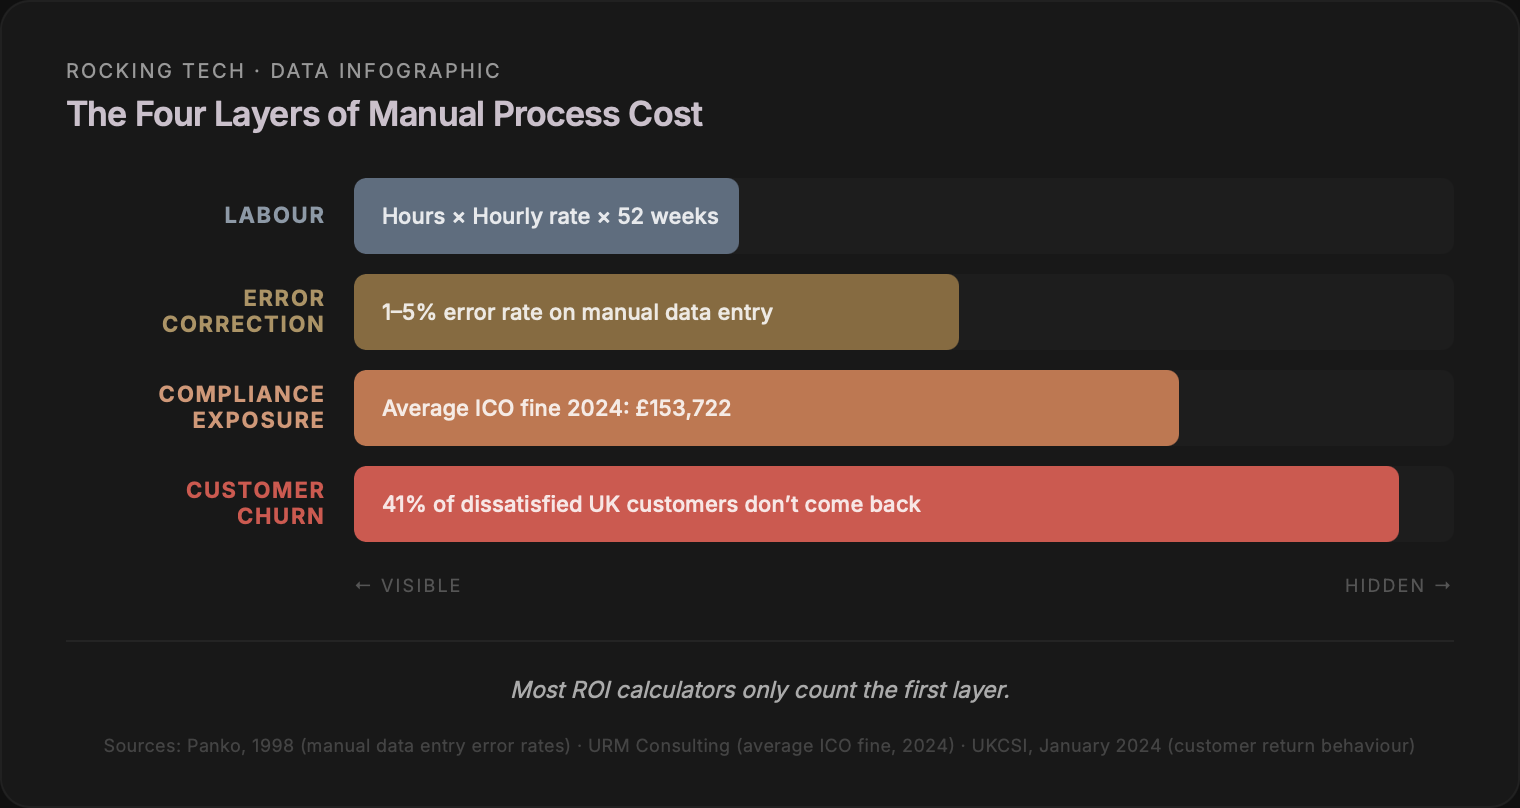
Step 3: Add the hidden multipliers
The labour cost is the visible part. The invisible part is often larger.
Error rates
The most rigorous academic work on manual data-entry error rates comes from Raymond Panko at the University of Hawaii, whose meta-analysis of over 300 operational spreadsheet audits and 1,000+ experimental subjects established a cell error rate of 1–5% in operational spreadsheets, with simple mechanical typing errors at approximately 0.5% and logical errors in complex tasks reaching 5% (Panko, Journal of End User Computing, 1998; updated 2008). This is the original source behind the "1–4% error rate" figure that circulates without attribution across automation vendor websites.
The cost of correcting errors follows what practitioners call the 1-10-100 rule: £1 to prevent at source, £10 to find and fix downstream, £100 if it reaches a customer or regulator. The rule originates from Labovitz and Chang's Making Quality Work (HarperBusiness, 1992). It is a heuristic, not a controlled empirical finding — but it captures a real pattern. An invoice entered with the wrong amount costs minutes to fix if caught immediately, hours if it triggers a customer dispute, and potentially thousands if it creates a tax discrepancy that surfaces during an audit.
Compliance exposure
The compliance cost of manual process failure is not hypothetical. It has a published enforcement record.
The most instructive UK case: in August 2023, the Police Service of Northern Ireland uploaded a spreadsheet as part of a Freedom of Information response. A hidden tab exposed the personal data of 9,483 serving officers and civilian staff. The ICO fined PSNI £750,000 — and stated explicitly that the fine would have been £5.6 million without public-sector discretion (ICO Penalty Notice, October 2024). The cause was not a cyber attack. It was a manual spreadsheet handling error.
Across 2024, the ICO issued 18 fines totalling £2.7 million, averaging £153,722 per fine (URM Consulting, analysis of ICO public enforcement register, 2024).
The FCA's 2024 enforcement record tells a parallel story in financial services. Starling Bank received a fine of nearly £29 million after automated sanctions screening — misconfigured since 2017 — was compounded by manual compensating controls that also failed (FCA, Final Notice, September 2024). TSB was fined £10.9 million with £99.9 million in customer redress after inadequate manual policies in collections affected 232,849 customers (FCA, Final Notice, October 2024). Metro Bank's Final Notice documented over 1.35 million transaction records rejected in a single month before a fix was applied, with manual reconciliation described as insufficiently defined (FCA, Final Notice, 2024).
These are large organisations. For an SME, the scale is smaller but the principle is identical: a manual process that handles personal data, financial records, or regulated information carries regulatory exposure proportional to the volume of data it touches.
Customer churn
The Institute of Customer Service's UK Customer Satisfaction Index — surveying approximately 15,000 UK consumers covering 59,500 customer experiences per edition — found that service failures cost UK organisations £7.3 billion per month in lost employee time (UKCSI, January 2025). More directly: 41% of customers dissatisfied with a business simply avoid using it again (UKCSI, January 2024).
Separate research found 54% of UK consumers rate timely responses as the single most valued element of customer service, with an average tolerance of just 2.3 poor experiences before complaining publicly (Retail Times, citing Trustpilot UK research, 2025; sample size not disclosed in summary).
Your turn: estimate the hidden costs
These are harder to quantify precisely, but even rough numbers change the calculation.
H. Errors per month in this process (estimate): ________
I. Average time to correct each error (minutes): ________
J. Annual error-correction cost: (H × I ÷ 60) × C × 12 = £ ________
K. Does this process handle personal data, financial records, or regulated information? If yes, what is the worst realistic regulatory outcome? (Even a £5,000 ICO reprimand costs more than most automation projects.)
L. Does slow execution of this process risk losing customers? If yes, estimate conservatively: how many customers per year, and what is their lifetime value?
M. Revised annual cost: G + J + (any amount from K or L you can defend) = £ ________
Step 4: Understand what automation actually costs
The UK SME automation agency market is young — most firms were founded between 2023 and 2025. Across the agencies I reviewed, a single-workflow build typically runs £800–£1,500, a small multi-workflow project sits at £2,000–£5,000, and AI agent builds start at £4,000. Day rates cluster around £800. Monthly retainers for ongoing support start at £200–£500.
Two things worth noting. First, fewer than half the agencies I reviewed publish pricing on their website. The rest gate it behind a discovery call, which means you cannot compare value without committing time to multiple conversations. Second, almost every agency makes the same headline claim: "save 15–20 hours per week" and "ROI within 30–60 days." The uniformity of the promise should make you cautious. The ROI depends entirely on the specifics of your process, your costs, and your volume — not on a generic claim.
Our AI Automation Solution is a fixed-fee engagement from £2,500 for a single workflow automation targeting a specific manual process. The price is published because you should be able to run the ROI calculation before you speak to us, not after.
Your turn: get to the payback number
You now have everything you need.
N. Cost of the automation project (get a fixed-fee quote, or use £2,500 as a benchmark): £ ________
O. Automation efficiency rate: 70%. (Automation handles the repetitive, rules-based portion. Someone still manages exceptions and reviews edge cases. 60–80% is realistic; use 70% as a default.)
P. Annual saving: M × 0.70 = £ ________
Q. Payback period: N ÷ P = ________ years (multiply by 12 for months)
That is the number that tells you whether to proceed.
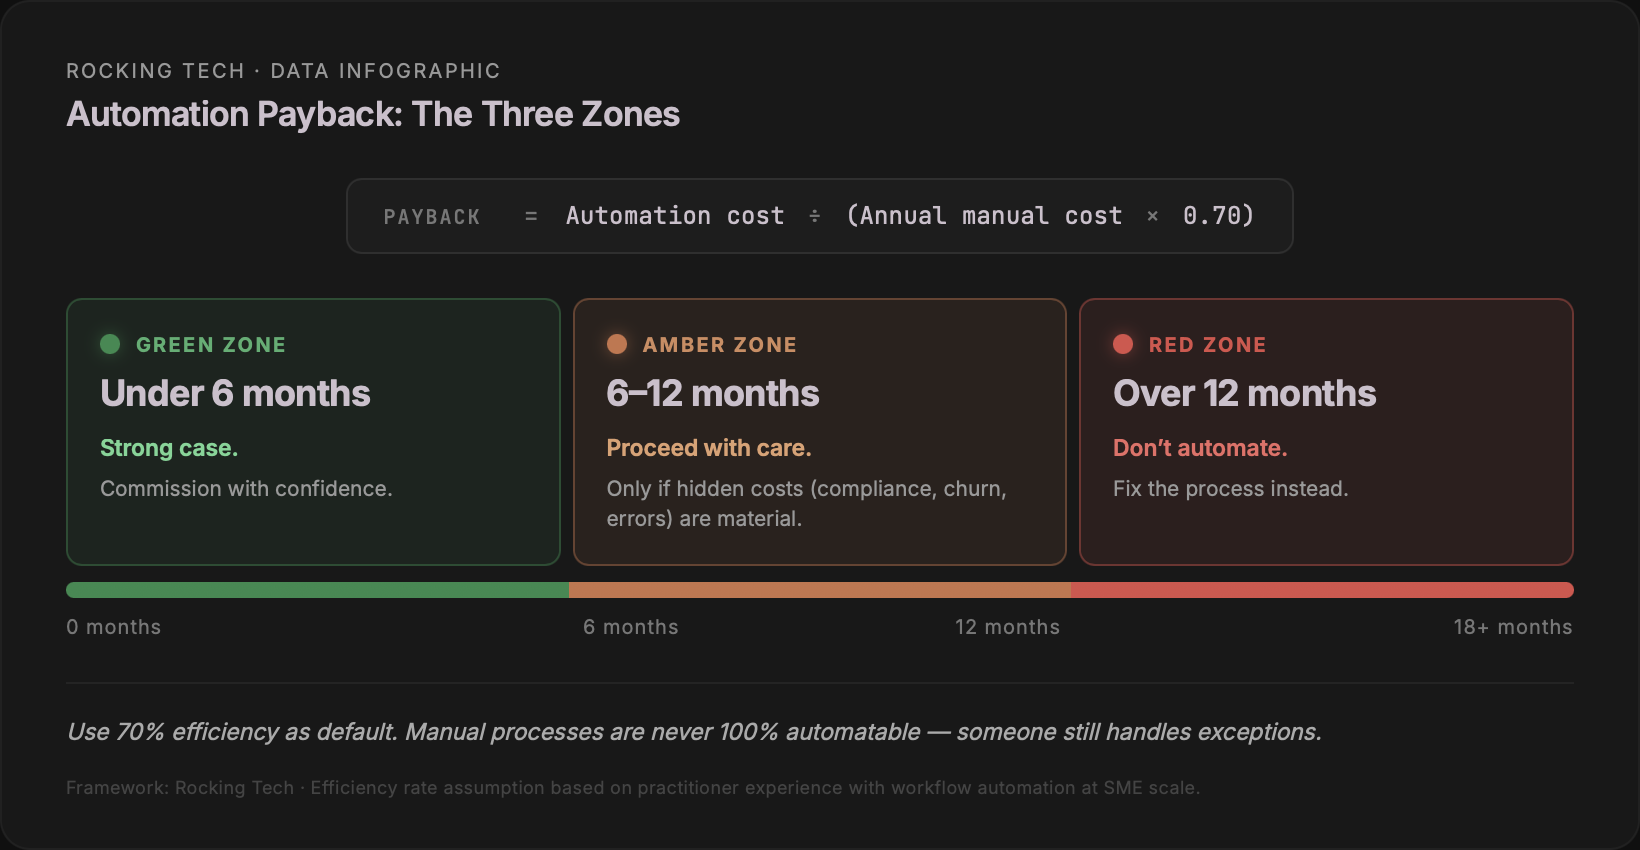
Step 5: Read the result honestly
The payback figure from Step 4 falls into one of three zones.
Under 6 months. Strong case. The automation pays for itself well within the first year, even if the efficiency rate turns out to be lower than 70% or adoption is slower than expected. There is margin for error.
6 to 12 months. It depends. If the hidden multipliers from Step 3 are significant — real compliance exposure, measurable customer churn, high error rates — the case may still be sound. If the hidden costs are minimal and the payback is driven almost entirely by labour savings, the margin for error is thin. A 10% overestimate in hours or a slower-than-expected adoption curve pushes the payback past a year.
Over 12 months. Unless there is a compelling compliance or risk-reduction argument, the honest answer is: do not automate this process. A better template, a shared checklist, ten minutes of training, or a small change to the workflow might solve the problem at zero cost. We have written about what to automate first — and sometimes the answer is "not this."
Step 6: Adjust for what most agencies won't tell you
Three factors systematically distort ROI calculations, and they all favour the agency selling the project.
Adoption is not automatic
Building the automation is half the work. Getting your team to use it is the other half. A 2025 survey of over 1,500 UK business leaders found that only 11% of UK SMEs use technology to a "great extent" to automate or streamline operations — despite broader AI adoption reaching 54% by March 2026 (BCC/Intuit, September 2025; BCC/Atos, March 2026). The gap between having the tool and using the tool consistently is where adoption failures live.
The DBT/Ipsos SME Tech Adoption study — 3,001 UK SMEs surveyed to ISO 20252 standard — found that AI adoption rates vary sharply by size: 41% of medium firms versus 19% of micro businesses (DBT/Ipsos, July 2025). The constraint is not technology availability. It is implementation capacity.
No UK-specific study has published a methodologically robust automation project failure rate for the 2024–2026 period. The figure that circulates — 30–50% of initial RPA projects fail — originates from EY's internal observation based on their global delivery experience (EY, 2017). It is directionally useful but dated and not UK-specific. The honest statement: a significant minority of automation projects fail to deliver expected ROI, primarily because of poor scoping and inadequate adoption — not technology failure.
Maintenance is not free
An automation that works on day one will not work forever. APIs change. The tools you connect to update their interfaces. Your business processes evolve. A Zapier workflow that routes leads to the right team member breaks when you restructure teams. A Make scenario that formats invoices stops working when your accounting software updates its API.
Budget for ongoing maintenance. Middleware subscriptions (Zapier, Make, n8n) are recurring costs. If you commission custom automation, factor in someone checking it monthly and fixing what breaks.
The opportunity cost cuts both ways
The standard automation pitch says the time your team saves will be redirected to revenue-generating work. In practice, it depends on whether the freed time is actually used productively or simply absorbed into other low-value tasks.
Your turn: the adoption gut-check
Before you commission, answer these three questions honestly:
R. Who in the team will own this automation day-to-day? (If the answer is "no one specifically," the adoption risk is high.)
S. If this automation saves your accounts person 10 hours per week, what specific higher-value work will they do with that time? (If the answer is vague, the revenue uplift is not guaranteed — the cost saving is still real, but do not count the uplift in your ROI.)
T. What is the monthly cost of the middleware tools (Zapier, Make, etc.) required to keep this running? (Subtract this from your annual saving at line P.)
The market context — and why honest scoping matters
A 2025 BCC/Intuit study found that 39% of UK business leaders cite difficulty identifying the right use cases as their primary barrier to AI adoption (BCC/Intuit, September 2025). Not cost. Not technology. The inability to figure out what to automate and whether it is worth doing.
That finding aligns with what we see in practice. The businesses that get the best results from automation are not the ones that automate the most. They are the ones that automate the right thing — the single process where the time, cost, and error profile creates a clear payback — and get it working properly before moving to the next.
The UK Made Smarter programme, which provides matched funding for SME digital adoption, has published case studies documenting this pattern. Pinkmans Bakery in Bristol automated a single production process and recovered 45 hours of skilled labour per week while generating an additional £2,000 per week in new wholesale revenue (Made Smarter South West, January 2025). Firstplay Dietary Foods invested £120,000 in automated packing equipment and increased production capacity tenfold (Made Smarter NW, October 2022). Both started with one process, measured the result, then expanded.
The businesses that struggle are the ones that try to automate everything at once, or that automate a process without first understanding the real cost of doing it manually. As one UK Business Forums poster summarised: the overwhelming response from other businesses is "interesting idea, but we can't afford to do it right now." That objection dissolves when the ROI calculation is specific and defensible. It persists when the pitch is generic.
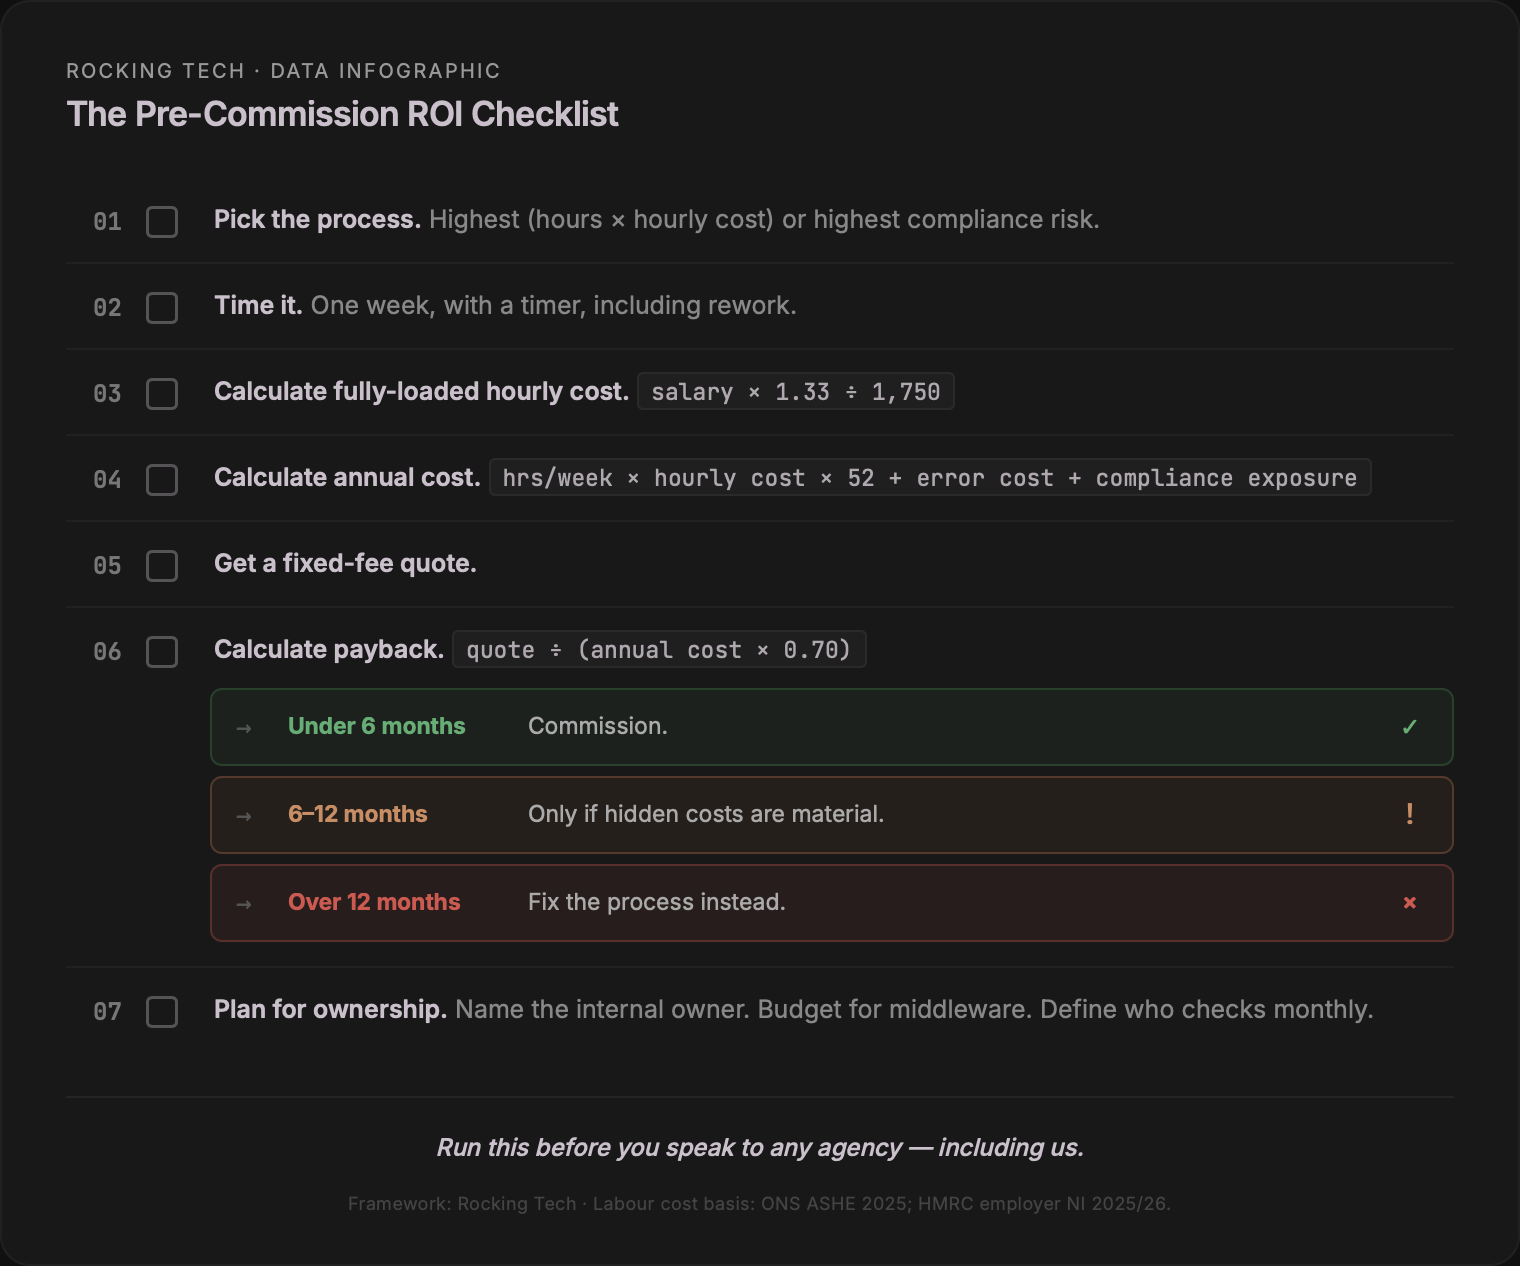
The pre-commission checklist
You have now done the work that most agencies skip. Here is the sequence in summary:
1. Identify the candidate process — highest hours × highest hourly cost, or highest error and compliance exposure.
2. Time it for one representative week with a timer. Log actual hours including rework.
3. Calculate the fully-loaded hourly cost. Base salary × 1.30–1.35 ÷ 1,750.
4. Annual manual cost = hours/week × hourly cost × 52. Add error correction and compliance exposure.
5. Get a fixed-fee quote. Not a day-rate estimate — a fixed price for a defined scope.
6. Payback = quote ÷ (annual cost × 0.70). Under 6 months: strong. 6–12 months: depends on hidden costs. Over 12 months: fix the process manually.
7. Plan adoption and maintenance. Name the internal owner. Budget for middleware. Define who checks it monthly.
If the numbers work
You now have something most people never get before commissioning automation: an honest answer.
If your payback period landed in the green zone — under six months — the next step is scoping. Not a generic conversation about AI. A focused look at the specific process you have just costed, the systems it touches, and what a production-grade automation needs to handle reliably.
That is what our AI Automation Solution is built for. Fixed fee, from £2,500, for a single workflow automation targeting a specific manual process. We audit the workflow, build it, integrate it with your existing tools, and hand it over. If the ROI calculation you have just run does not support the investment, we will tell you — because a project that does not pay for itself is not a project worth delivering.
If you are still unsure which process to start with, the free MVP Readiness Score will help you identify where the biggest gains sit before you commit to anything.
Let us find the one thing worth automating
Prefer email? hello@rockingtech.co.uk